Thursday, January 12, 2017

2017 MLS Superdraft Analysis

Last year my Superdraft model did fairly well, given that it only uses college and PDL team name, position, GA status, and USYNT history. However, this year it didn't seem to be as accurate with three North Carolina players(Colton Storm, Walker Hume, and Tucker Hume) projected to go over 2000 minutes while none seemed to be particularly close, so I've decided to try a different method. You can find that model under Raw Computer Model Exp. Mins in the posted spreadsheet with all the raw data used for my new method.

I first created a polynomial model for minutes played in the first two years and then used mock drafts and big boards to simulate where the player was picked and run the player's position in the mock draft/big board into the polynomial model to create Expected Minutes played numbers.

You can view the full viz here, it takes a while for it to load sometimes and is a bit small for my taste.


A couple of notes:

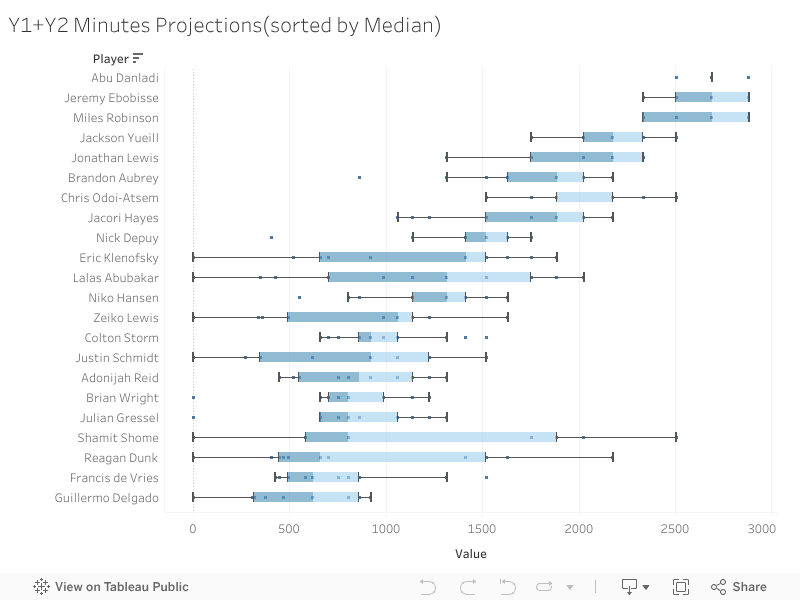
Since Abu Danladi was only selected first, second, or third and was most often selected second, his box plot is just a straight line. However, this doesn't mean that Danladi has a very high chance to play exactly 2690 minutes, the box plot appears this way because he is selected second in more than half the mock drafts.

Also this has a slight bias towards Soccer By Ives' draft material since it has published 7 mock drafts and big boards compared to TopDrawerSoccer's 4 and MLSSoccer.com's 2. This reflects especially in Reagan Dunk's boxplot, as SBI has ranked him anywhere between 21 and 31 compared to the TDS' range of 5 to 11.

Finally, I used a clustering algorithm to cluster the results to form more concrete “rankings,” that describe the difference between two players that normal 1,2,3,4... rankings do not provide. The difference between Jeremy Ebobisse and Abu Danladi is one spot if you rank the players, the same difference between Jacori Hayes and Nick DePuy. However, there is really no difference between Ebobisse’s and Danladi’s expected minutes (0 difference in median exp. mins) and there is a much bigger difference between Hayes’ and DePuy’s expected minutes(366 difference in median exp. mins).


PositionsCluster#(as appears on spreadsheet)Players(Median Exp. Mins)
1-32Abu Danladi(2690)
Jeremy Ebobisse(2690)
Miles Robinson(2507)
4-88Jackson Yueill(2176)
Jonathan Lewis(2176)
Chris Odoi-Atsem(1886)
Brandon Aubrey(1886)
Jacori Hayes(1886)
9-127Nick DePuy(1520)
Eric Klenfovsky(1414)
Niko Hansen(1316)
Lalas Abubakar(1316)
13-24(w/6)3Zeiko Lewis(1061)
Justin Schmidt(922)
Julian Gressel(804)
Guillermo Delgado(621)
Francis DeVries(621)
Walker Hume(585)
Christian Thierjung(585)
13-24(w/3)6Colton Storm(922)
Adonijah Reid(863)
Brian Wright(804)
Shamit Shome(804)
Reagan Dunk(661)
25-311Brian Nana-Sinknam(551)
Nazeem Bartman(469)
Chris Nanco(407)
Jordan Wilson(407)
Michael Amick(361)
Jakob Nerwinski(337)
Marcus Epps(243)
31-44415 players
46-69525 players

These clusters are determined algoritmically with a little extra weight to drafts published on the 13th. I'm not sure how exactly clusters 3 and 6 are different, when I eventually figure this out I'll update this.

Interestingly FC Dallas whittled down the combine invitees to a 29 player list, it would be interesting to see the overlap.

Teams picking at the beginning of a new cluster(like Columbus picking at 9th) should keep track of where players from previous clusters go and target players that fall outside of their cluster positions. It might have looked like Atlanta made a misstep when it traded for the 8th pick but it looks like just the right position according to the clusters, because I would bump up Shome due to his GA status.

*I only used Soccer By Ives, TopDrawerSoccer, and MLSSoccer.com for their big boards and mock drafts since I trust their credibility. Other mock drafts are can be found by NBCSport's ProSoccerTalkBleacherReport, and SBNation.

**I used the second version of the MLS Combine invite list. This excludes players like Trevor Haberkorn, Liam Callahan, and Alex Neff who appeared on multiple mock drafts and bog boards.

***I published a modified version of this to Quakes Epicenter on the 12th before four more big boards/mock drafts were posted. The clusters of the top groups contain all the same players other than the new cluster analysis adding Nanco, Nerwinski, and Epps.

Wednesday, July 27, 2016

Looking at prospective MLS head coaches

Recently I've compiled a list of guys I would consider interviewing for a head coaching job if I was in charge of an MLS team. It is meant to be a wide but thin overview of head coaches and I'll add any suggestions. The list is broken down into four sections:

  • MLS 1.0 guys: guys who had success in MLS 1.0 and now are assistants / recently out or work
  • MLS 3.0 guys: young assistants and college coaches who could follow the recent trend of Gregg Berhalter, Jesse Marsch, and Caleb Porter
  • Internationals: coaches from abroad with considerable success
  • MLS 3.0 Internationals: young international coaches with experience in MLS/the U.S..

Performance data is taken from transfermarkt, ages are as of July 27, 2016

MLS 1.0:
CoachWikiTransfermarktW%D%L%PPGAge
Dave SarachanLinkLink42.321.536.21.4862
Denis HamlettLinkLink39.528.931.61.4747
Sigi SchmidLinkLink45.421.832.91.5863
Hamlett coached the Fire in 2008 and 2009, reaching the Eastern Conference Final in both years, but was fired. Despite his younger age, he was placed in the 1.0 category because he hasn't held a head coaching role in MLS since 2009.

MLS 3.0:

CoachWikiTransfermarktW%D%L%PPGAge
Josh WolffLinkLink


39
Ante RazovLinkLink


42
Pat NoonanLinkLink


35
Kerry ZavagninLinkLink


42
Giovanni SavareseLinkLink53.525.620.91.8646
Carlos LlamosaLinkLink47
Alecko EskandarianLinkLink34
Tab RamosLinkLink50.011.138.91.6149
Wilmer CabreraLinkLink30.823.146.21.1548
Carlos Somoano*LinkUNC??
Kevin GrimesLinkUC Berkley54.433.112.42.2948
Jeremy GunnLinkStanford61.724.713.92.09??
Hugo PerezLink
67.018.714.32.2052
Most of these guys are assistants so they don't have records to show. The bottom four sans Perez are all college coaches. Hugo Perez doesn't really fit into this category but fits better with MLS 3.0 than any of the other categories.

International:

CoachWikiTransfermarktW%D%L%PPGAge
Gus PoyetLinkLink43.828.627.61.6048
Paul SturrockLinkLink38.024.937.11.3959
Paul ClementLinkLink42.436.421.21.6444
Steve CotterillLinkLink37.527.734.81.4052
Martín LasarteLinkLink45.020.434.61.5655
José Luis SierraLinkLink47.322.230.51.6447
Reinaldo RuedaLinkLink52.020.028.01.7659
Giorgos DonisLinkLink47.227.125.61.6946
I really have no experience with rating international managers, but over the years I've kept track of names that interested me. Paul Sturrock caught my eye with this feature on him in 2012. Paul Clement, one of Carlo Anclotti's trusted assistants taking a job at Derby County in 2015 also opens the door for an MLS team.

MLS 3.0 International:

CoachWikiTransfermarktW%D%L%PPGAge
Simo ValakariLinkLink55.918.225.91.8643
Guillermo Barros SchelottoLinkLink44.330.625.11.6343
Eduardo CoudetLinkLink49.130.920.01.7841
Marcello GallardoLinkLink49.748.322.11.7740
Steve CherundoloLinkLink33.30.066.71.0037
David WagnerLinkLink34.527.737.91.3144
Valakari took over Finnish club SJK in 2012. For context, SJK were founded in 2007 and were just promoted to Finland's second tier. In his first three years, he achieved promotion, came in second, and won the Finish league, ending HJK's six year streak. Like the other top four, he played in MLS so hopefully he speaks English well.

*Somoano's stats are as of August 2015

Monday, June 29, 2015

What Wins Games (Part 1)

In the last possession article, I concluded that possession is pointless although there was a small sample size. Recently, I built a scraper to scrape the match stats from every MLS match this season. The results point towards the same conclusion.


Possession
Win % with 55% or more possession27.03%
Win % with 45% or less possession41.67%

So if not possession, they what? Shot Dominance, the ratio of a team's shots to its opponents' shots and Shots on Target Ratio, the ratio of a teams shots on target to the total shots on target are also tools used to evaluate match outcomes. The results of the tests of these two metrics are below


Possession
Win % with 2.5X or more shot dominance58.33%
Win % with .4x or less shot dominance21.43%


Possession
Win % with .75 or more STR70.59%
Win % with .25 or less STR7.89%

In conclusion, STR is the best predictive metric available readily on MLS Match Reports.

Analyzing the Amarikwa-Harden trade

Recently, San Jose and Chicago exchanged Ty Harden and Quincy Amarikwa, which looks to be a good deal for both sides. In every trade, there does not have to be a direct winner and loser: on the surface, Chicago recieved center back depth while San Jose acquired a starting forward. And salary wise, both are on the cheap: Amarikwa earned $60,000 guaranteed in 2014; Harden, $71,665.

First, the Whoscored and Squawka Indexes:


Harden(W)Harden(S)Amarikwa(W)Amarikwa(S)Adailton(W)Adailton(S)Jahn(W)Jahn(S)
20156.94736.56566.811756.59-41
20146.682117.02256----5.86-56
20136.98756.48110----6.60122

Harden seems like he is around Adailton's level. Amarikwa seems to be an inconsistent performer, playing excellent in 2014 but okay in 2013 and 2015. However, he seems better Jahn. Jahn twice achieved negative ratings and is only slightly ahead of Amarikwa this year. Amarikwa will eventually start performing better and Jahn worse as they regress towards the mean.

Another tool for player evaluation is radars, pioneered by Ted Knutson. Here are this season's comparisons for the Amarikwa and Jahn below:

Amarikwa in Red, Jahn in Blue


The radars paint a wholesome picture. Amarikwa is better in passing and dribbling, having more key passes and a higher passing accuracy. However, Jahn contributes more defensively, and is dispossessed less. But since both seem to be having off years, here is the comparison for their best years (2014 for Amarikwa, 2013 for Jahn)
2014 Amarikwa in Red, 2013 Jahn in Blue
The same trends hold true: Jahn with good defensive work and ball control and Amarikwa with better passing. Note that Jahn played less than half of the minutes Amarikwa played - 1001 vs 2550.

Saturday, February 21, 2015

The Correlation between Expansion Draft success and actual performance

This year, people seemed to be all over Orlando City's seemingly mediocre Expansion draft. But the folks in Orlando beg to differ - according to the Orlando Sentinel, "While studying past expansion drafts, Orlando City leaders saw the most successful clubs had focused more on filling out the depth within a roster."

So this gave me the idea - did teams previously use the expansion draft for depth? How many starters were recruited via the expansion draft ? Do good expansion draft picks lead to first year success? I have summarized my findings in the table below, but before that couple of points: First, if a player recruited via expansion draft has played more than 2000 minutes, I consider him to be a starter; if a player has played more than 1000 minutes, I consider added depth. Any player who has not played 1000 minutes, is probably waste of a draft pick.

Note: I've used PPG as a measure of success because of the number of games in a season varies


YearTeamTotal minutes# of players who
played 1000+ mins
# of players who
played 2000+ mins
PPG
2005Real Salt Lake~7000610.63
2007Toronto354000.83
2008San Jose8964521.10
2009Seattle9412331.57
2010Philadelphia12146531.03
2011Portland4211211.24
2011Vancouver6519300.82
2012Montreal9633521.24

Clearly, not many starters were recruited via expansion draft, in fact not many depth players either - only 4 (out of 8) expansion teams were able to recruit 5 or more of their depth players via expansion draft.

Seattle was clearly the most successful team, recruiting three starters via expansion draft - James Riley, Nate Jaqua and Brad Evans. Philadelphia, on the other hand, was just middle of the pack in terms of PPG, though they also recruited 3 starters -  Stefani Miglioranzi, Jordan Harvey and Alejandro Moreno. Philadelphia recruited depth players too from the draft; they were clear leaders in terms of minutes played by their expansion draft recruits. Portland managed to find only one starter and just one more depth player, still they did pretty well in their first year, second behind Seattle and tied with Montreal, who did a decent draft (2 starters and 3 depth). So, clearly, recruiting via expansion draft is not the deciding factor of putting together a new team.

Seattle depended on overseas recruitment for their starters including prominent stars as Freddie Ljungberg and Fredy Montero and used their USL team as well for a few starters like Sebastian LeToux. Seems Orlando also believes in that strategy with signings like Kaka and Bryan Rochez in addition to USL star Kevin Molino.