Thursday, January 12, 2017

2017 MLS Superdraft Analysis

Last year my Superdraft model did fairly well, given that it only uses college and PDL team name, position, GA status, and USYNT history. However, this year it didn't seem to be as accurate with three North Carolina players(Colton Storm, Walker Hume, and Tucker Hume) projected to go over 2000 minutes while none seemed to be particularly close, so I've decided to try a different method. You can find that model under Raw Computer Model Exp. Mins in the posted spreadsheet with all the raw data used for my new method.

I first created a polynomial model for minutes played in the first two years and then used mock drafts and big boards to simulate where the player was picked and run the player's position in the mock draft/big board into the polynomial model to create Expected Minutes played numbers.
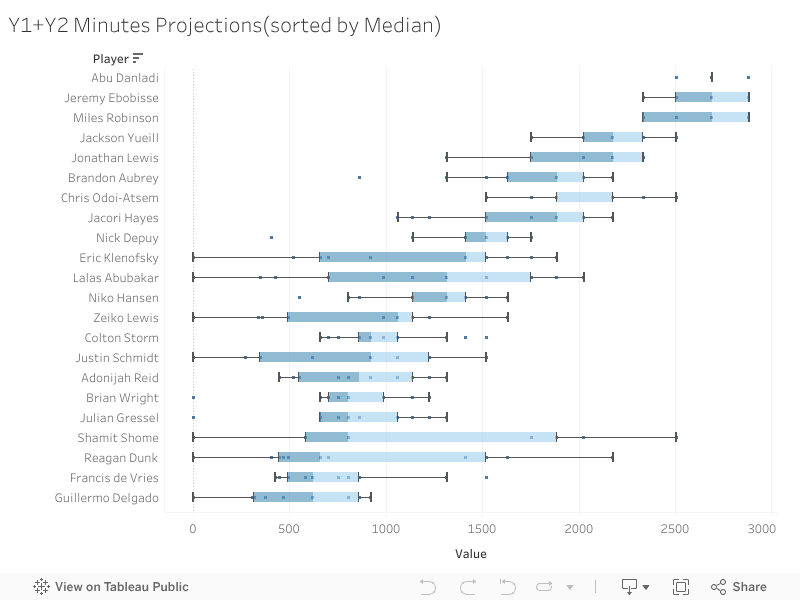
You can view the full viz here, it takes a while for it to load sometimes and is a bit small for my taste.


A couple of notes:

Since Abu Danladi was only selected first, second, or third and was most often selected second, his box plot is just a straight line. However, this doesn't mean that Danladi has a very high chance to play exactly 2690 minutes, the box plot appears this way because he is selected second in more than half the mock drafts.

Also this has a slight bias towards Soccer By Ives' draft material since it has published 7 mock drafts and big boards compared to TopDrawerSoccer's 4 and MLSSoccer.com's 2. This reflects especially in Reagan Dunk's boxplot, as SBI has ranked him anywhere between 21 and 31 compared to the TDS' range of 5 to 11.

Finally, I used a clustering algorithm to cluster the results to form more concrete “rankings,” that describe the difference between two players that normal 1,2,3,4... rankings do not provide. The difference between Jeremy Ebobisse and Abu Danladi is one spot if you rank the players, the same difference between Jacori Hayes and Nick DePuy. However, there is really no difference between Ebobisse’s and Danladi’s expected minutes (0 difference in median exp. mins) and there is a much bigger difference between Hayes’ and DePuy’s expected minutes(366 difference in median exp. mins).


PositionsCluster#(as appears on spreadsheet)Players(Median Exp. Mins)
1-32Abu Danladi(2690)
Jeremy Ebobisse(2690)
Miles Robinson(2507)
4-88Jackson Yueill(2176)
Jonathan Lewis(2176)
Chris Odoi-Atsem(1886)
Brandon Aubrey(1886)
Jacori Hayes(1886)
9-127Nick DePuy(1520)
Eric Klenfovsky(1414)
Niko Hansen(1316)
Lalas Abubakar(1316)
13-24(w/6)3Zeiko Lewis(1061)
Justin Schmidt(922)
Julian Gressel(804)
Guillermo Delgado(621)
Francis DeVries(621)
Walker Hume(585)
Christian Thierjung(585)
13-24(w/3)6Colton Storm(922)
Adonijah Reid(863)
Brian Wright(804)
Shamit Shome(804)
Reagan Dunk(661)
25-311Brian Nana-Sinknam(551)
Nazeem Bartman(469)
Chris Nanco(407)
Jordan Wilson(407)
Michael Amick(361)
Jakob Nerwinski(337)
Marcus Epps(243)
31-44415 players
46-69525 players

These clusters are determined algoritmically with a little extra weight to drafts published on the 13th. I'm not sure how exactly clusters 3 and 6 are different, when I eventually figure this out I'll update this.

Interestingly FC Dallas whittled down the combine invitees to a 29 player list, it would be interesting to see the overlap.

Teams picking at the beginning of a new cluster(like Columbus picking at 9th) should keep track of where players from previous clusters go and target players that fall outside of their cluster positions. It might have looked like Atlanta made a misstep when it traded for the 8th pick but it looks like just the right position according to the clusters, because I would bump up Shome due to his GA status.

*I only used Soccer By Ives, TopDrawerSoccer, and MLSSoccer.com for their big boards and mock drafts since I trust their credibility. Other mock drafts are can be found by NBCSport's ProSoccerTalkBleacherReport, and SBNation.

**I used the second version of the MLS Combine invite list. This excludes players like Trevor Haberkorn, Liam Callahan, and Alex Neff who appeared on multiple mock drafts and bog boards.

***I published a modified version of this to Quakes Epicenter on the 12th before four more big boards/mock drafts were posted. The clusters of the top groups contain all the same players other than the new cluster analysis adding Nanco, Nerwinski, and Epps.

Wednesday, July 27, 2016

Looking at prospective MLS head coaches

Recently I've compiled a list of guys I would consider interviewing for a head coaching job if I was in charge of an MLS team. It is meant to be a wide but thin overview of head coaches and I'll add any suggestions. The list is broken down into four sections:

  • MLS 1.0 guys: guys who had success in MLS 1.0 and now are assistants / recently out or work
  • MLS 3.0 guys: young assistants and college coaches who could follow the recent trend of Gregg Berhalter, Jesse Marsch, and Caleb Porter
  • Internationals: coaches from abroad with considerable success
  • MLS 3.0 Internationals: young international coaches with experience in MLS/the U.S..

Performance data is taken from transfermarkt, ages are as of July 27, 2016

MLS 1.0:
CoachWikiTransfermarktW%D%L%PPGAge
Dave SarachanLinkLink42.321.536.21.4862
Denis HamlettLinkLink39.528.931.61.4747
Sigi SchmidLinkLink45.421.832.91.5863
Hamlett coached the Fire in 2008 and 2009, reaching the Eastern Conference Final in both years, but was fired. Despite his younger age, he was placed in the 1.0 category because he hasn't held a head coaching role in MLS since 2009.

MLS 3.0:

CoachWikiTransfermarktW%D%L%PPGAge
Josh WolffLinkLink


39
Ante RazovLinkLink


42
Pat NoonanLinkLink


35
Kerry ZavagninLinkLink


42
Giovanni SavareseLinkLink53.525.620.91.8646
Carlos LlamosaLinkLink47
Alecko EskandarianLinkLink34
Tab RamosLinkLink50.011.138.91.6149
Wilmer CabreraLinkLink30.823.146.21.1548
Carlos Somoano*LinkUNC??
Kevin GrimesLinkUC Berkley54.433.112.42.2948
Jeremy GunnLinkStanford61.724.713.92.09??
Hugo PerezLink
67.018.714.32.2052
Most of these guys are assistants so they don't have records to show. The bottom four sans Perez are all college coaches. Hugo Perez doesn't really fit into this category but fits better with MLS 3.0 than any of the other categories.

International:

CoachWikiTransfermarktW%D%L%PPGAge
Gus PoyetLinkLink43.828.627.61.6048
Paul SturrockLinkLink38.024.937.11.3959
Paul ClementLinkLink42.436.421.21.6444
Steve CotterillLinkLink37.527.734.81.4052
Martín LasarteLinkLink45.020.434.61.5655
José Luis SierraLinkLink47.322.230.51.6447
Reinaldo RuedaLinkLink52.020.028.01.7659
Giorgos DonisLinkLink47.227.125.61.6946
I really have no experience with rating international managers, but over the years I've kept track of names that interested me. Paul Sturrock caught my eye with this feature on him in 2012. Paul Clement, one of Carlo Anclotti's trusted assistants taking a job at Derby County in 2015 also opens the door for an MLS team.

MLS 3.0 International:

CoachWikiTransfermarktW%D%L%PPGAge
Simo ValakariLinkLink55.918.225.91.8643
Guillermo Barros SchelottoLinkLink44.330.625.11.6343
Eduardo CoudetLinkLink49.130.920.01.7841
Marcello GallardoLinkLink49.748.322.11.7740
Steve CherundoloLinkLink33.30.066.71.0037
David WagnerLinkLink34.527.737.91.3144
Valakari took over Finnish club SJK in 2012. For context, SJK were founded in 2007 and were just promoted to Finland's second tier. In his first three years, he achieved promotion, came in second, and won the Finish league, ending HJK's six year streak. Like the other top four, he played in MLS so hopefully he speaks English well.

*Somoano's stats are as of August 2015

Monday, June 29, 2015

What Wins Games (Part 1)

In the last possession article, I concluded that possession is pointless although there was a small sample size. Recently, I built a scraper to scrape the match stats from every MLS match this season. The results point towards the same conclusion.


Possession
Win % with 55% or more possession27.03%
Win % with 45% or less possession41.67%

So if not possession, they what? Shot Dominance, the ratio of a team's shots to its opponents' shots and Shots on Target Ratio, the ratio of a teams shots on target to the total shots on target are also tools used to evaluate match outcomes. The results of the tests of these two metrics are below


Possession
Win % with 2.5X or more shot dominance58.33%
Win % with .4x or less shot dominance21.43%


Possession
Win % with .75 or more STR70.59%
Win % with .25 or less STR7.89%

In conclusion, STR is the best predictive metric available readily on MLS Match Reports.

Analyzing the Amarikwa-Harden trade

Recently, San Jose and Chicago exchanged Ty Harden and Quincy Amarikwa, which looks to be a good deal for both sides. In every trade, there does not have to be a direct winner and loser: on the surface, Chicago recieved center back depth while San Jose acquired a starting forward. And salary wise, both are on the cheap: Amarikwa earned $60,000 guaranteed in 2014; Harden, $71,665.

First, the Whoscored and Squawka Indexes:


Harden(W)Harden(S)Amarikwa(W)Amarikwa(S)Adailton(W)Adailton(S)Jahn(W)Jahn(S)
20156.94736.56566.811756.59-41
20146.682117.02256----5.86-56
20136.98756.48110----6.60122

Harden seems like he is around Adailton's level. Amarikwa seems to be an inconsistent performer, playing excellent in 2014 but okay in 2013 and 2015. However, he seems better Jahn. Jahn twice achieved negative ratings and is only slightly ahead of Amarikwa this year. Amarikwa will eventually start performing better and Jahn worse as they regress towards the mean.

Another tool for player evaluation is radars, pioneered by Ted Knutson. Here are this season's comparisons for the Amarikwa and Jahn below:

Amarikwa in Red, Jahn in Blue


The radars paint a wholesome picture. Amarikwa is better in passing and dribbling, having more key passes and a higher passing accuracy. However, Jahn contributes more defensively, and is dispossessed less. But since both seem to be having off years, here is the comparison for their best years (2014 for Amarikwa, 2013 for Jahn)
2014 Amarikwa in Red, 2013 Jahn in Blue
The same trends hold true: Jahn with good defensive work and ball control and Amarikwa with better passing. Note that Jahn played less than half of the minutes Amarikwa played - 1001 vs 2550.

Saturday, February 21, 2015

The Correlation between Expansion Draft success and actual performance

This year, people seemed to be all over Orlando City's seemingly mediocre Expansion draft. But the folks in Orlando beg to differ - according to the Orlando Sentinel, "While studying past expansion drafts, Orlando City leaders saw the most successful clubs had focused more on filling out the depth within a roster."

So this gave me the idea - did teams previously use the expansion draft for depth? How many starters were recruited via the expansion draft ? Do good expansion draft picks lead to first year success? I have summarized my findings in the table below, but before that couple of points: First, if a player recruited via expansion draft has played more than 2000 minutes, I consider him to be a starter; if a player has played more than 1000 minutes, I consider added depth. Any player who has not played 1000 minutes, is probably waste of a draft pick.

Note: I've used PPG as a measure of success because of the number of games in a season varies


YearTeamTotal minutes# of players who
played 1000+ mins
# of players who
played 2000+ mins
PPG
2005Real Salt Lake~7000610.63
2007Toronto354000.83
2008San Jose8964521.10
2009Seattle9412331.57
2010Philadelphia12146531.03
2011Portland4211211.24
2011Vancouver6519300.82
2012Montreal9633521.24

Clearly, not many starters were recruited via expansion draft, in fact not many depth players either - only 4 (out of 8) expansion teams were able to recruit 5 or more of their depth players via expansion draft.

Seattle was clearly the most successful team, recruiting three starters via expansion draft - James Riley, Nate Jaqua and Brad Evans. Philadelphia, on the other hand, was just middle of the pack in terms of PPG, though they also recruited 3 starters -  Stefani Miglioranzi, Jordan Harvey and Alejandro Moreno. Philadelphia recruited depth players too from the draft; they were clear leaders in terms of minutes played by their expansion draft recruits. Portland managed to find only one starter and just one more depth player, still they did pretty well in their first year, second behind Seattle and tied with Montreal, who did a decent draft (2 starters and 3 depth). So, clearly, recruiting via expansion draft is not the deciding factor of putting together a new team.

Seattle depended on overseas recruitment for their starters including prominent stars as Freddie Ljungberg and Fredy Montero and used their USL team as well for a few starters like Sebastian LeToux. Seems Orlando also believes in that strategy with signings like Kaka and Bryan Rochez in addition to USL star Kevin Molino.

Wednesday, January 14, 2015

5 year performance of MLS teams

Here is a table I made to rank the overall team performance of all MLS teams over the last five years. After some deliberation, I included Portland, Vancouver and Montreal. Even though they have not played all five years, at least all of them played more than 100 matches. Due to the inclusion of the three, I used points per game to evaluate the teams' performance.

TeamPoints 2010+11+12+13+14Points per game
LA Galaxy [1]59 + 67 + 54 + 53 + 61 = 2941.77
Seattle [2]48 + 63 + 56 + 52 + 64 = 2831.70
Real Salt Lake [3]56 + 53 + 57 + 56 + 56 = 2781.67
New York [4]51 + 46 + 57 + 59 + 50 = 2631.58
Sporting Kansas City [5]39 + 51 + 63 + 58 + 49 =2601.57
Columbus [6]50 + 47 + 52 + 41 + 52 = 2421.46
Dallas [7]50 + 52 + 39 + 44 + 54 = 2391.44
San Jose Earthquakes [8]46 + 38 + 66 + 51 + 30 = 2311.39
Houston [9]33 + 49 + 53 + 51 + 39 = 2251.36
Portland [10]X + 42 + 34 + 57 + 49 = 1821.34
Chicago [11]36+ 43 + 57 + 49 + 36 = 2211.33
Colorado [12]46 + 49 + 37 + 51 + 32 = 2151.29
Vancouver [13]X + 28 + 43 + 48 + 50 =  1691.24
Philadelphia [14]31 + 48 + 36 + 46 + 42 = 2031.22
New England [15]32 + 28 + 35 + 51 + 55 = 2011.21
DC United [16]22 + 38 + 59 + 16 + 59 = 1941.17
Montreal [17]X + X + 42 + 49 + 28 = 1191.17
Toronto [18]35 + 33 + 23 + 29 + 54 = 1741.05
Chivas [19]28 + 36 + 30 + 26 + 33 = 153.92

A few observations:
  • MLS is known for its parity and it shows. The top team has got about 1.7 times more points per game than the worst time. For the Premier League, it is about triple - the champion gets about 90 points where as the bottom team gets around 30
  • The top two teams are no surprise - they each have 3 DPs, including superstars like Keane, Dempsey, Donovan etc... However, Toronto landed at the bottom of the table. Lesson: It is not the money that counts but the smart money.
  • A relatively low budget team RSL has done surprisingly well to take the third spot. More over, they have shown remarkably well in terms of consistency: in their best year, they got 57 points, but their worst year they got 53 points, less than 10% down. Additionally, they got 56 points in each of the other three years.
  • DC United and San Jose Earthquakes on the other hand are most inconsistent teams. Both had very good year as well as very bad years. In their bad years, they got less than half of their good year points totals.
  • Most teams alternate between good and bad years
  • However, there are two teams that show year-over-year improvement for last 4 years: New England and Vancouver.

Saturday, January 10, 2015

Superdraft rankings of MLS teams, 2015 edition

As draft day 2015 nears, I thought I should update my last year's post on MLS teams' performance in the Superdraft. This time, while ranking the teams, I've taken into consideration of the number of first round picks the teams used to give teams with a low number of draft picks an even playing field. Otherwise, my basic methodology remains the same - to count the number of draft picks who've played 1000+ minutes in their first two seasons. There are six 2014 rookies who has played more than 1000 minutes in their first season itself, they have been included. The rational for the 1000 minute rule can be found at my earlier post here. Players will count for whatever team drafted them, regardless of trades, as this is about recruitment not development.

I included Portland, Vancouver and Montreal but did not rank them since there is not enough data for them, though Vancouver has done better than the other new entrants.

Like last time, New England and DC have remained as the top two teams in recruiting via Superdraft, while Philadelphia and Chicago has fallen behind - Philadelphia hasn't recruited a single player in the last two years, who met my 1000 minute criteria. Galaxy has done surprisingly well considering that they got low draft picks, except for 2009. Colorado have had the most improvement over the last two years, drafting Deshorn Brown, Dillon Powers, and Jared Watts. Also, Seattle and Columbus remain at the bottom of the draft recruitment rankings.

TeamNumber of draft picks who played
1000+ minutes in first two seasons
 Number of first round picks used  (2009-2013) Three players who clocked most minutes
(first two year's minutes)
Chicago  [B]             4                3 Austin Berry (5580)
Jalil Anibaba (5441)
Sean Johnson (3690)
Chivas             6                6Ben Zemanski (3599)
Zarek Valentin (3275)
Michael Lahoud (2556)
Colorado [C]             4                4Dillon Powers (2457)
Deshorn Brown (2169)
Tony Cascio (2222)
Columbus [D]             4                6Rich Balchan (1705)
Dilly Duka (1624)
Justin Meram (1475)
DC United [A]             8                5Perry Kitchen (5890)
Nick DeLeon (4087)
Chris Korb (3341)
Dallas  [B]             6                6Matt Hedges (4815)
Zach Loyd (4496)
George John (3300)
Houston [B]             5                4Will Bruin (4731)
Warren Creavalle (2504)
Kofi Sarkodie (1804)
LA Galaxy [A]             8                5Omar Gonzalez (5192)
A.J. DeLaGarza (3061)
Michael Stephens (3005)

Montreal

             1                3Eric Miller (1646)
Blake Smith (319)
New England [A+]            10                6Andrew Farrell (5653)
A.J. Soares (5075)
Kelyn Rowe (4630)
New York [B]             5                4Tim Ream (5670)
Tony Tchani (1722)
Ryan Meara (1620)
Philadelphia [B+]             7                5Raymon Gaddis (4278)
Michael Farfan (4262)
Zac MacMath (3555)
Portland             2                3Darlington Nagbe (4428)
Andrew Jean-Baptiste (2568)
Real Salt Lake [C]             4                4Chris Schuler (1728)
Collen Warner (1566)
Sebastian Velasquez (1537)
San Jose Earthquakes [C]             4                4Steven Beitashour (2295)
Brad Ring (2035)
Ike Opara (1399)
Seattle  [D]             3                4Steve Zakuani (4278)
Alex Caskey (1093)
Eriq Zavaleta (1354)
Sporting Kansas City [C]            4                5CJ Sapong (4306)
Teal Bunbury (3431)
Matt Besler (3252)
Toronto [B]            8               7Luis Silva (4043)
Joao Plata (2391)
Aaron Maund (1217)
Vancouver            4               5Jeb Brovsky (3742)
Erik Hurtado (2294)
Darren Mattocks (2211)

Thursday, August 7, 2014

Expert Analysis or Snake Oil?

Every week, MLSSoccer.com releases their power rankings, its supposed experts' views on how various team are supposed to play the next few rounds. However, most of the time there isn't really any real analysis and lots of biased malarkey.

For instance, when San Jose was on a hot streak towards the end of last season, they  were still stuck around 12th on the list and covered it up with trash like, "Pretty depressing results for the Quakes this past weekend. Obvious must-win against Colorado on Wednesday night," and, "If either Colorado or LA lose this weekend, San Jose will be one point out of the playoffs and even on games played. With games against Colorado and LA coming up. Parity rules."

In contrast, PremierLeague.com provides the scores of last six games instead of trying to rank its teams. So, I decided to compare the power rankings with form (PPG from their last five games) and see which one comes closer to the next five games PPG. I decided to take one week from the beginning and end of the year to see if it makes any difference.

The average difference is the average of all MLS teams' differences between expected results(PPG of Power rankings rank) and the actual result(next five games PPG). For example, if FC Dallas is first in the power rankings but only ranks 13th in PPG from their next five games, their difference would be twelve. The averages are totaled up for all MLS teams and averaged to figure out the average difference.

 Week Power Rankings average differenceLast 5 PPG average difference
136.055.2
3154.5

Although slightly, the PPG still outpreforms power rankings. Probably if the strength of schedule is also factored in, the results will become even more precise, possibly an interesting topic to explore in the future.

If interested, here is a link to the raw data
https://docs.google.com/spreadsheets/d/1YGe93Dr2P9Jy2WVHyC3Y6ztEZbPA-I7nxM4541kk6fg/edit#gid=0

Thursday, April 17, 2014

MLS Head Coaching Bias Part 2: Playing Experience

At the end of my post on MLS coaches lacking experience, I mentioned that I also was going to follow up with a look at if MLS teams also prefer head coaches with playing experience. Here is a table comparing the top two leagues in the world, La Liga and the EPL with MLS

 League  Percent of head coaches w/ playing experience  Fraction 
MLS95%18/19
EPL100%20/20
La Liga85%17/20

Interestingly, all leagues overlook managers with no playing experience. The only manager who has no managing or playing experience, Fran Escribia of Elche, led them to the first division after a 25 year absence. The only MLS head coach with no professional playing experience is Sigi Schmid - who has the most wins in the history of MLS. MLS and teams all around the world should stop having this prejudice while looking for a new head coach and reap the rewards.

MLS Head Coaching Bias Part 1: Coaching Experience

Recently, I noticed a trend of MLS coaches being hired for their first professional head coaching gig. although guys like Caleb Porter offer a new perspective on building a team, I thought it may not be the best idea. So, I took a look and compared the percentage of first-time MLS Head Coaches and the percentages of the top two leagues in the world. I didn't include college and youth national team coaching as 'experience'(sorry Caleb Porter and John Hackworth), but decided to put Francisco Javier Rodríguez Vilchez of Almeria in the head coaching experience group due to the fact that he coached Almeria's B team, which plays in the Spanish third division

 League  Percent of first time head coaches  Fraction 
MLS68%13/19
EPL15%3/20
La Liga10%2/20

Even more frightening, there is only one MLS head coach to have started outside MLS. Even though coaches like Aron Winter and Ruud Gullit have failed in MLS, experienced managers tend to preform better due to the 10,000 hour rule mentioned in Malcolm Gladwell's book Outliers. Teams should also stop hiring just managers with playing experience. When Carlo Ancelotti was asked about the subject of playing experience, he commented, "I don't see the connection. My dentist is the best in the world, but he's never had a particularly bad toothache." I'll take look at that in a future post.

Which wins championships, offense or defense

Bear Bryant once famously proclaimed, "Offense sells tickets, but defense wins championships." Football statisticians have proved that wrong so I decided to check if that is true in soccer too. So I took a look back at MLS Cups and conference finals going back to 2002 and looked at the team's goals for and goals against to determine which team is better offensively and which team is better defensively. The results are below.

Better Offense, Better DefenseBetter Offense, Worse DefenseWorse Offense, Better DefenseWorse Offense, Worse Defense
1112103

The takeaway here is that it doesn't matter in the battle between offense and defense. A trend I noticed was thyat generally, in the first few MLS Cups, more defensive teams won. In 2003, only better defensive, worse offensive teams won. In comparison, 2012 was only better offensive, worse defensive teams.

Wednesday, April 9, 2014

Does possession matter?

Last month when Michael Bradley commented that possession is overrated, it rekindled an age old debate whether more possession leads to more wins. The MLSsoccer.com article took the opposing side, citing a graph showing the percentage of teams with more than 50 percent of the possession who made the playoffs. Around the same time, the MLSsoccer.com also published an article that San Jose Earthquakes, the winner of Supporter’s shield in 2012 was the best attacking team in the MLS history. When checking their stats, I noticed that they managed to win many times despite having less possession. I digged deeper - and San Jose Earthquakes are not alone, so did New York Red Bulls on their way to winning Supporter Shield in 2013 - in fact they had a very convincing win over Dynamo (3-0) with as little as 39% possession. I picked up few more games at random, and sure enough there were plenty of examples in MLS last season where side with lower possession won.

At this point, I decided to investigate further, collecting more data points systematically. I picked up three rounds (2, 18 and 32) in the beginning, middle and end of the season and looked at all the games that produced a result.What I found was that there is some positive correlation between more possession and winning, unfortunately the correlation is not very strong, as shown below(I didn't include ties):

 More Possession  Equal Possession(49-51%)  Less Possession 
13 wins7 wins12 wins

So, I would rather agree with Michael Bradley, possession is indeed over rated. It is a factor but not an overwhelming one, at least in MLS. In search of other factors,  I looked at few other statistics like total shots, shots on goal, duals won etc. So far I have not been able to find any single overwhelming factor but found that shots on target has higher correlation with win than possession. I took the same games from last year and compared the winning and losing team's shots on goal data.

 More Shots on Goal  Equal Shots on Goal  Less Shots on Goal 
17 wins8 wins7 wins

As a side note, I observed that only three teams in 32 games managed to win in spite of having less possession and also with fewer shots on goal. For one of them, possession was almost equal (47% vs 53%) and difference of shots on goal was just 1;  in another instance, the winning team’s goalkeeper was MOTM, and in the third case the winning side had two stoppage time goals. I'll be sure to revisit this topic in a future post with more factors and data and hope to pinpoint three things which a team must focus on in order to win.
*Here is a link to the data which I have collected

Saturday, March 15, 2014

Thousand minute rule explained

While commenting on MLS Superdraft, I mentioned that almost all future stars of MLS played at least 1000 minutes in their first two seasons. The only notable exceptions are Chris Wondolowski and a handful of goalkeepers - who anyway are usually late bloomers. I got the idea that such a rule might exist from Malcom Gladwell's book Outliers - The story of success. The second chapter of the book "10,000 hour rule" tells us that in any field, from music to ice hockey to computer programming, there are no "natural"s, most successful people have actually practiced much harder to their peers during their formative years. Here is a look at the number of minutes played for drafted players who later became successful in MLS, using the top 100 Castrol Index for 2013 as the success criteria.

Player Castrol Index rank Year of joining MLS
Number of minutes played in first two seasons
Mike Magee             3 (2003) - 3238
Chris Wondolowski             5 (2005) - 203
Jack McInerney             6 (2010) - 1026
Nick Rimando             7 (2000) - 4302
Eddie Johnson             9 (2001) - 611    (Started at age of 17)
Graham Zusi            10 (2009) - 1064
Ryan Johnson            15 (2006 + 2008) - 1733  (Did not play in 2007)
Will Bruin           18 (2011) - 4731
Drew Moor           19 (2005) - 3433
Dominic Oduro           22 (2006) - 1638
John Busch           23 (2002) -  3900
Zac MacMath           26 (2011) - 3555
Shea Salinas           27 (2008) - 1850
Brad Davis           32 (2002) - 3154
Nathan Sturgis           33 (2006) - 2393
Rodney Wallace           34 (2009) -  3189
Chad Marshall           36 (2004) - 5101
Matt Besler           37 (2009) -  3252
Dilly Duka           40 (2010) - 1624
George John           41 (2009) -  3600
Deshorn Brown           42 (2013) - 2169 (only first year)
Omar González           43 (2009) -  5851
Amobi Okugo           51 (2010) - 1248
Patrick Nyarko           52 (2008) -  2254
Chance Myers           53 (2008) -  846   (Had an injury in second year)
Bernardo Anor           54 (2011) - 1133
Ike Opara           55 (2010) - 1399
Matt Hedges           57 (2012) - 4815
Dan Kennedy           63 (2008 + 2010) - 1293  (Did not play in 2009)
Dillon Powers           64 (2013) - 2457 (only first year)
Stephen McCarthy           65 (2011) - 3746
Todd Dunivant           66 (2003) -  4258
A.J. DeLaGarza           69 (2009) -  3482
Warren Creavalle           72 (2012) -  2504
Darlington Nagbe           75 (2011) -  4428
Michael Farfan           76 (2011) -  4262
Kelyn Rowe           78 (2012) - 4630
Justin Mapp           84 (2002) -  1476
Seth Sinovic           85 (2010) -  3582
Ricardo Clark           94 (2003) -  4355
Jeff Larentowicz           95 (2005) -  1975

Sunday, February 23, 2014

Trading scorecard of MLS teams

In the previous post, I mentioned that I would go in-depth about the anomalies behind the performance of MLS teams and their player recruitment scorecard - Superdraft and overseas combined. I think I have found why teams like Real Salt lake and San Jose have done so well even though they did not recruit that many quality players through Superdraft and overseas recruitment.

Let's take a look at the third source of player recruitment - trade, specially the trades that have resulted in the receiving team having a player in the top 100 PAR list from 2011 onwards. Both Real Salt Lake and San Jose Earthquake have managed to lure away 5 elite players from other teams! RSL's best trade is Kyle Beckerman from Colorado and Earthquake's best trade is Chris Wondolowski  from Houston! By comparison, Dallas has gained 3 players via trade and two of them have not made any contribution in last two years. They are sort of middle of the pack (11th in points earned last 3 seasons) even though their combined Superdraft and overseas recruitment scorecard is pretty good - 5 th.

TeamNumber of players recruited via trades who have made the
top 150 list at least  one of
the seasons 2011 or 2012 or 2013
Player (highest PAR position, best year) - year of trade
Chicago3Mike Magee (4, 2013)  - 2013
Dominic Oduro (19, 2011) - 2011
Dilly Duka (54, 2013) - 2013
Chivas3Juan Pablo Angel (41, 2011) - 2011
Nick LaBrocca (48, 2011) - 2011
Heath Pearce (75, 2011) - 2011
Colorado5Drew Moor (2, 2011) - 2009
Marvell Wynne (30, 2011) - 2010
Jeff Larentowicz (45, 2011) - 2010
Nathan Sturgis (61, 2013) - 2013
Matt Pickens (67, 2012) - 2009
Columbus2Dominic Oduro (23, 2013) - 2013
Eddie Gaven (47, 2011) - 2006
DC United2Dwayne DeRosario (26, 2011) - 2011
Maicon Santos (58, 2012) - 2012 
Dallas3Ugo Ihemelu (9, 2011) - 2009
Kevin Hartman (41, 2012) - 2010
Maicon Santos (53, 2011) - 2011
Houston4Bobby Boswell (6, 2011) - 2008
Macoumba Kandji (44, 2012) - 2012
Brad Davis (44, 2011) - 2005
Calen Carr (57, 2012) - 2011
LA Galaxy2Todd Dunivant (27, 2011) - 2009
Edson Buddle (96, 2012) - 2012
Montreal1Troy Perkins (54, 2012) - 2012
New England0
New York3Kenny Cooper (14, 2012) - 2012
Fabian Espindola (64, 2013) - 2013
Jamison Olave (68, 2013) - 2013
Philadelphia2Conor Casey (30, 2013) - 2013
Sebastien Le Toux (69, 2013) - 2012
Portland5Donovan Ricketts(1, 2013) - 2012
Ryan Johnson (24, 2013) - 2013
Rodney Wallace (60, 2013) - 2011
Will Johnson (65, 2013) - 2013
Jack Jewsbury (80, 2011) - 2011
Real Salt Lake5Nick Rimando (5, 2013) - 2006
Kyle Beckerman (50, 2013) - 2007
Will Johnson (59, 2011) - 2008
Robbie Findley (71, 2013) - 2007
Chris Wingert (98, 2011) - 2007
San Jose Earthquakes5Chris Wondolowski (2, 2012) - 2009
Steven Lenhart (4, 2012) - 2011
Alan Gordon (8, 2012) - 2011
Shea Salinas (52, 2013) - 2012
Marvin Chavez (100, 2012) - 2012
Seattle2Eddie Johnson (13, 2013) - 2012
Lamar Neagle (22, 2013) - 2013
Sporting Kansas City3Kei Kamara (6, 2012) - 2009
Ike Opara (35, 2013) - 2013
Benny Feilhaber (39, 2013) - 2013
Toronto2Ryan Johnson (39, 2012) - 2011
Milos Kocic (66, 2011) - 2010
Vancouver1Brad Knighton (57, 2013) - 2012


3 Year team performance and combined (Superdraft plus overseas) recruitment scorecard of MLS teams

First, here is a table I made to rank the overall team performance of all MLS teams over the last three years. Excluded Montreal since they joined only in 2012.

TeamPoints 2011+12+13Rank
Chicago43 + 57 + 49 = 1498
Chivas36 + 30 + 26 = 9217
Colorado49 + 37 + 51 = 13710
Columbus47 + 52 + 41 = 1409
DC United38 + 59 + 16 = 11316
Dallas52 + 39 + 44 = 13511
Houston49 + 53 + 51 = 1537
LA Galaxy67 + 54 + 53 = 1741
New England28 + 35 + 51 = 11415
New York46 + 57 + 59 = 1625
Philadelphia48 + 36 + 46 = 13013
Portland42 + 34 + 57 = 13312
Real Salt Lake53 + 57 + 56 = 1664
San Jose Earthquakes38 + 66 + 51 = 1556
Seattle63 + 56 + 52 = 1713
Sporting Kansas City51 + 63 + 58 =1722
Toronto33 + 23 + 29 = 8518
Vancouver28 + 43 + 48 =  11914

Next, I added the quality players (based on PAR rating) recruited from Drafts and overseas. I included players drafted via Superdraft and overseas since 2009, for Portland and Vancouver, since 2011. The first row in the table is of course no surprise - LA Galaxy has twice won MLS Cup in last 3 years and they managed to recruit 15 top quality players via Superdraft or overseas, including players like Omar Gonzalvez and Robbie Keane. In the top one third of the table, (1-6), there are couple of surprises though. Performance rank of Real Salt Lake is 4th, but their combined recruitment scorecard is 12th! Even stranger anomaly is 6th position holder San Jose Earthquakes, their combined recruitment score card is 17th of 18 teams, only recruited 6 quality players via Superdraft and from overseas clubs!

I will look at this anomaly at a future post.

TeamSuperdraft players + overseas recruits = TotalRank(Total)
1. LA Galaxy6 + 9  = 151-T
2. Sporting Kansas City6 + 6  = 127-T
3. Seattle2 + 12 = 143-T
4. Real Salt Lake3 + 6 = 912-T
5. New York4 + 11 = 151-T
6. San Jose Earthquakes4 + 2 = 617-T
7. Houston4 + 5 = 912-T
8. Chicago Fire4 + 6 = 109-T
9. Columbus3 + 6 = 912-T
10. Colorado3 + 3 = 617-T
11. Dallas4 + 9 = 135-T
12. Portland2 + 6 = 815
13. Philadelphia7 + 3 = 109-T
14. Vancouver2 + 10 = 127-T
15. New England9 + 5  = 143-T
16. DC United6 + 1 = 716
17. Chivas6 + 4 = 109-T
18. Toronto6 + 7  = 135-T

A lot of things stand out from this list. San Jose is in the top third but are tied for last in overall player recruits. Dallas is tied for fifth but is stuck in the second third and New England are tied for third but dwell in the bottom third. I'll address these issues in the next post.

Saturday, February 22, 2014

Overseas player recruitment scorecard of MLS teams

In my previous post about the Superdraft, I showed that some teams drafted better than others based on Superdrafts from 2010 to 2012. But, some teams like Seattle have done very well even though they did not find any gems in Superdrafts between 2010 to 2012; only one of their recruits (Alex Caskey) has played more than 1000 minutes in his first two years So why is that? There are multiple ways to acquire talent and now I'll take a look at another source - international players.

I'll take a look at another source of talent - overseas clubs. Most clubs have at least couple of their starters recruited internationally, mostly from CONCACAF countries or South American countries though rich clubs like LA and New York have recruited some of the top players from Europe.

Not all overseas recruits make an impact for their MLS clubs though, in fact less than half have done it. I have made a list of overseas players who have made to either  Castrol Index or PAR list in at least one of the years from 2011 to 2013. PAR list is not widely known, so let me tell a bit about it. It stands for Points Above Replacement and was created by Dave Laidig, and is modeled after baseball’s Wins Above Replacement  (WAR) stats. More details can be found at www.par-stat.com. I found that the list of names are mostly common but a few players who have played very well for few games but didn't play much did not make it to the Castrol Index list but made it to the PAR list. This is because Castrol Index gives high weight to number of minutes played. One example is Vancouver's Kekuta Manneh (recruited via Superdraft)

TeamNumber of overseas
recruits who has made the
top 150 list at least  one of
the seasons 2011 or 2012 or 2013
Three best overseas recruits
Chicago6Marco Pappa
Arne Friedrich
Alex
Chivas4Maicon Santos
Erick Torres
Michael Umana
Colorado3Hendry Thomas
Jaime Castrillon
Jamie Smith
Columbus6Federico Higuaín
Jairo Arrieta
Emilio Renteria
DC United1Hamdi Salihi 
Dallas9David Ferreira
Jair Benitez
Marvin Chavez
Houston5Oscar Boniek García
Jermaine Taylor
Lovel Palmer 
LA Galaxy9Robbie Keane
David Beckham
Juninho
Montreal6Marco Di Vaio
Felipe Martins
Alessandro Nesta
New England5Jose Gonçalves
Saer Sene
Jerry Bengtson
New York11Tim Cahill
Thierry Henry
Juan Pablo Angel
Philadelphia3Lionard Pajoy
Keon Daniel
Carlos Valdes
Portland6Diego Valeri
Pa-Modou Kah
Diego Chara
Real Salt Lake6Javier Morales
Fabian Espindola
Jamison Olave
San Jose Earthquakes2Victor Bernardez
Simon Dawkins
Seattle12Osvaldo Alonso
Mauro Rosales
Fredy Montero
Sporting Kansas City6Aurelien Collin
Jimmy Nielsen
Oriol Rosell 
Toronto7Danny Kovermans
Adrian Cann
Robert Earnshaw
Vancouver10Camilo
Gershon Koffie
Lee Young-Pyo

-One of the tools many MLS clubs utilize is agent Alejandro Taraciuk. Taracuik is a former MLS intern-turned-agent who helped establish Real Salt Lake's 2009 championship team by recommending Fabian Espindola, Javier Morales, and Jamison Olave. Taracuik pratically represents MLS in South America; he also brought Jorge Perlaza, Diego Chara, and Diego Valeri to Portland as well as Fredy Montero and Jhon Kennedy Hurtado to Seattle. Taraciuk also said, "I have been responsible for bringing approximately 70 players to the league and without doubt Diego Valeri is one of the best players I have placed in MLS." It would be interesting to find the role of agents in international players coming in. Teams also seem to focus around certain regions like Montreal in Italy.

-It is worth noting that there is no direct co-relation between recruiting quality players from overseas clubs and success in MLS. Dallas has recruited 9 international players and  Vancouver has 10 players who have been starters for them, still they had far less success than San Jose, who have just two significant overseas recruits during the same period - and Simon Dawkins of them was on loan from parent club Tottenham. So really they just have Victor Bernardez to show for.

So, there are more ways to assemble a good team, than drafting and overseas scouting. I'll cover it in a future post.

Wednesday, January 15, 2014

Superdraft score card of MLS teams


Well, some say that past performance is no guarantee for future performance. But on the eve of the Superdraft, I decided to give my two cents. I decided to base my research on recent years instead of last 10 years since the coaching staff for many clubs survives for around three years and no current coach has survived in the same team for ten years.

My methodology is simple; I just checked the picks made by various MLS teams in the 2010/2011/2012 Superdrafts and count the number of players they picked up who played in MLS for 1000 minutes or more in their rookie and sophomore year combined. I picked up 1000 minutes for couple of reasons. First, 1000 minutes imply that the player has at least few starts and is definitely much more than late sub. Second and most important, I found some thing interesting, almost all future stars of MLS played at least 1000 minutes in their first two seasons. Only big exception is Chris Wondowlski and a handful of goalkeepers, who anyways are usually late bloomers. So, while playing for 1000 minutes in the first couple of seasons always do not lead to a future successful MLS career, they are almost a pre-requisite and indicates a good pick.

The table below is almost like a kaleidoscope! You twist and turn it and look at it from another angle and you would get a different winner ! For example, if we use the sum of the top 3 players (playing minutes wise) as the winning criteria, Chicago is the clear winner! However, no matter which way one looks at it,  it is pretty obvious that in teams like Philly, Chicago, New England and DC are far superior to San Jose, Seattle and Colorado in picking up right player at Superdraft. Another interesting side note, as you'd probably guess, Toronto's three 1,000 minute guys? All are no longer with the team.

Note: I did not include Portland, Vancouver and Montreal, since they did not participate in all three of the Superdrafts 2010-12

TeamNumber of draft picks who played
1000+ minutes in first two seasons
Three players who clocked most minutes
Chicago3Austin Berry (5580)
Jalil Anibaba (5441)
Sean Johnson (3690)
Chivas4Ben Zemanski (3599)
Zarek Valentin (3275)
Blair Gavin (2327)
Colorado1Tony Cascio (2222)
Andre Akpan (492)
Ross LaBauex (485)
Columbus3Rich Balchan (1705)
Dilly Duka (1624)
Justin Meram (1475)
DC United4Perry Kitchen (5890)
Nick DeLeon (4087)
Chris Korb (3341)
Dallas3Matt Hedges (4815)
Zach Loyd (4496)
Eric Alexander (2272)
Houston3Will Bruin (4731)
Warren Creavalle (2504)
Kofi Sarkodie (1804)
LA Galaxy4Michael Stephens (3005)
Tommy Meyer (1694)
Paolo Cardozo (1513)
New England6A.J. Soares (5075)
Kelyn Rowe (4630)
Stephen McCarthy (3746)
New York3Tim Ream (5670)
Tony Tchani (1722)
Ryan Meara (1620)
Philadelphia7Raymon Gaddis (4278)
Michael Farfan (4262)
Zac MacMath (3555)
Real Salt Lake3Chris Schuler (1728)
Collen Warner (1566)
Sebastian Velasquez (1537)
San Jose Earthquakes2Steven Beitashour (2295)
Ike Opara (1399)
Justin Morrow (869)
Seattle1Alex Caskey (1093)
Brian Meredith (990)
Servando Carrasco (924)
Sporting Kansas City2CJ Sapong (4306)
Teal Bunbury (3431)
Dom Dwyer (678)
Toronto3Luis Silva (4043)
Joao Plata (2391)
Aaron Maund (1217)

Reality check on the MLS Superdraft

In the last couple of weeks MLS web sites have been buzzing with Superdraft related material - and for good reason, the big day is just around the corner on the 16th. Instead of joining the bandwagon and starting the speculation of who will be drafted by which team and whose stock is rising or falling, I asked myself the question how much Superdraft really means to the MLS teams.

First, let me explain my methodology.

I made a list of top 100 players who are the "elite" class of players from 2013 using the Castrol Index; I picked 100 players since that represents approximately top 20% - MLS now has about 500 players among its 19 teams. The coaches would like to get their entire first eleven from these two groups, but only MLS Champion Kansas City managed to do this. Most teams had 4 to 6.

The Superdraft is not the only source of recruitment for MLS clubs. Clubs often recruit from overseas, which  includes Europe, South America and other CONCACAF countries. MLS teams also hold try-outs, and use their academies to develop "home grown" players. They also recruit players from the lower tiers of North American soccer, like the NASL and USL. MLS also recruits American players playing abroad and allocates them to a team via their allocation process.

What I found interesting is that Superdraft brought only 41 of 100 elite players to MLS, but remember these players were recruited over a span of 14 years from 2000 to 2013, so on average each year's super draft brought only about three future stars to MLS. Overseas players recruited 34 out of 100, is the next major source. All other sources roughly contributed one fourth.

So, what does this tell us ?

First, Superdraft is not the only definitely source of recruiting quality players; overseas may be more expensive and the players may take more time to adapt to MLS' physical style of play, but that is the distance between the playoff teams and non-playoff teams(You can see that Real Salt Lake got a head start in 2007 and 2008 by signing Fabian Espindola, Javier Morales, and Jamison Olave long before the explosion of talent in 2011 ans 2012). Second, not too many star players join via Superdraft every year, may be about three to five. So, don't get carried away by the buzz generated around 30+ players, most of whom will be forgotten soon.

Anyways, let me give you some good news, especially if your team doesn't have a high draft pick. Only half of the elite players were not top 10 drafts, and lot of players picked up from 11 to 30 became future MLS stars. Of course, if your favorite team's coach has real eye for diamond in the rough (or just lucky) can still spot another future Chris Wondolowski pick 89.

Top 100 players sorted by Castrol Index rank:

*Year is when the player joined MLS
PlayerYearSource of Recruitment
Donovan Ricketts2009Overseas Club
Marco Di Vaio2012Overseas Club
Mike Magee2003Draft pick #3
Robbie Keane2011Overseas Club
Chris Wondolowski2005Draft pick #89
Jack McInerney2010Draft pick #7
Nick Rimando2000Draft pick #35
Blas Pérez2012Overseas Club
Eddie Johnson 2001Draft pick #19
Graham Zusi   2009Draft pick #23
Diego Fagundez   2011Homegrown
Camilo Sanvezzo2011Overseas Club
Tim Cahill2012Overseas Club
Lamar Neagle 2009Trialist
Ryan Johnson 2006Draft pick #26
Thierry Henry 2010Overseas Club
Luis Robles 2012MLS Allocation
Will Bruin  2011Draft pick #11
Drew Moor2005Draft pick #6
Giles Barnes 2012Overseas Club
José Gonçalves2013Overseas Club
Dominic Oduro2006Draft pick #22
Jon Busch 2002Draft pick #23
Diego Valeri2013Overseas Club
Conor Casey2007MLS Allocation
Zac MacMath2011Draft pick #5
Shea Salinas2008Draft pick #15
Aurélien Collin2011Overseas Club
Marcelo Sarvas2012Overseas Club
Benny Feilhaber  2011MLS Allocation
Federico Higuaín2012Overseas Club
Brad Davis2002Draft pick #3
Nathan Sturgis2006Draft pick #12
Rodney Wallace2009Draft pick #6
Kyle Beckerman2000MLS Allocation
Chad Marshall2004Draft pick #2
Matt Besler2009Draft pick #8
Clinton Irwin2013USL
Javier Morales2007Overseas Club
Dilly Duka2010Draft pick #8
George John2009Draft pick #14
Deshorn Brown2013Draft pick #6
Omar González2009Draft pick #3
Sebastien Le Toux2009USL
Jamison Olave 2008Overseas Club
Erick Torres2013Overseas Club
Kenny Miller2012Overseas Club
Fabian Espindola2007Overseas Club
Landon Donovan2001MLS Allocation
Juninho2010Overseas Club
Amobi Okugo2010Draft pick #6
Patrick Nyarko2008Draft pick #7
Chance Myers2008Draft pick #1
Bernardo Anor2011Draft pick #48
Ike Opara2010Draft pick #3
Claudio Bieler2013Overseas Club
Matt Hedges2012Draft pick #11
Gyasi Zardes2013Homegrown
Pa-Modou Kah2013Overseas Club
Jairo Arrieta2012Overseas Club
Will Johnson2005Trialist
Michael Gspurning2012Overseas Club
Dan Kennedy2005Draft pick #38
Dillon Powers2013Draft pick #11
Stephen McCarthy2011Draft pick #24
Todd Dunivant2003Draft pick #6
Oscar Boniek García2012Overseas Club
Robert Earnshaw2013Overseas Club
A.J. DeLaGarza2009Draft pick #17
Oriol Rosell2013Overseas Club
Sheanon Williams2010USL
Warren Creavalle2012Draft pick #37
Josh Williams2010Trialist
Bobby Shuttleworth2009Trialist
Darlington Nagbe2011Draft pick #2
Michael Farfan2011Draft pick #23
Steven Caldwell2013Overseas Club
Kelyn Rowe2012Draft pick #3
Obafemi Martins2013Overseas Club
Soony Saad2011MLS Allocation
Jimmy Nielsen2010Overseas Club
Tally Hall2009Recruited by Club
Doneil Henry2010Homegrown
Justin Mapp2002Draft pick #4
Seth Sinovic2010Draft pick #25
Diego Chara2011Overseas Club
Jonathan Osorio2012Trialist
Osvaldo Alonso2009Overseas Club
Victor Bernardez2012Overseas Club
Djimi Traore2013Overseas Club
Lee Nguyen2012MLS Allocation
Andrew Jacobson2009MLS Allocation
Alvaro Saborio2010Overseas Club
Ricardo Clark2003Draft pick #2
Jeff Larentowicz2005Draft pick #45
Kenny Cooper2006Recruited by Club
Bobby Boswell2005Trialist
Andrew Driver2013Overseas Club
DeAndre Yedlin2013Homegrown
Troy Perkins2003Trialist

Tuesday, December 31, 2013

The Hidden Gem that slipped through the Re-Entry Draft

Regarding the Re-Entry draft, most picks were deemed necessary. San Jose added two new full-backs to replace Justin Morrow and Steven Beitashour(should he leave), DC selected two center-backs to replace Daniel Woolard and Dejan Jakovic(should he leave), and Portland selected Rodney Wallace's replacement for the start of the season. Out of the Re-Entry Draft's 68 number of players, 8 were in the top 150 of the Castrol Index. Only one of them went undrafted or untraded or unsigned: Daniel Woolard

Daniel Woolard's career had surged forward in 2011, and has started 20 games in each of the past three seasons. He started off as a center-back and was moved to a spot at left-back by DC United. It proved to be good decision, and he has been a mainstay ever since. Dennis Iapichino took his place after he was signed in August, leaving him expendable. Interestingly, in 2012, Alecko Eskandarian included him in an article about the 11 most underrated MLS players.

I decided to take a look at the Castrol Index, PAR stat and value of him over the last three years. I originally thought of the Castrol Index to be calculated in a similar fashion to the PAR stat. Only after looking at Woolard's ratings, however, I can see the massive gap.(I couldn't find his final rating for 2012, so I used the one from the Web Archive. It will be probably a few ratings off as the season was not over at the time of the cache. For the value, I used transfermarkt.


YearCastrolPARMinutesValue*
20111302332254100,000 
20121562721754125,000
20131412732235125,000

I'd see him fitting in at San Jose and New York very well. According to transfermarkt, he can play across the backline(I'm not sure he has played right-back before), and they have recently let go of back up left-back Justin Morrow and will also need center-back cover when their starting two center-backs will depart for Brazil in the summer. New York has recently gotten rid of defenders  David Carney, Heath Pearce and Brandon Barklage, and will likely cut Markus Holgersson soon. I'd hate to say Chivas USA would benefit from his presence as they would benefit from anybody's presence but they currently have a meager 4 defenders on their roster. So for the sake of comparison, here is the data for Morrow and Pearce:

Morrow:

YearCastrolPARMinutesValue*
2011291203810100,000
20121111552970125,000
20132193571937125,000

Pearce:

YearCastrolPARMinutesValue*
201180752581400,000
20121081372504400,000
20132522141083400,000

You can clearly see that both players are at about the same performance, with Woolard being the more consistent player, and at about $40,000 less salary than Morrow and 240,000 less than Pearce. Pearce's value has stayed the same for a long time but transfermarkt doesn't check the values for MLS players very often: the last time it changed was in 2009 and his value fell 600,000 in that year before he headed for MLS, so his value would be about the same as Woolard's.

*value in the tables is in British sterling
Note: I'm also interested in Ugo Ihemelu. If he would be healthy for the upcoming season, his combination of height and speed(for a center-back) would be worth taking a look at. In 2011, he was 13th in Castrol and 9th in PAR. There are also some young players with experience worth taking a look at. Tyler Polak is still on a GA deal and is only 21, Blair Gavin was formerly a GA and is still only 24, New England let go of Matt Horth, the 24-year old forward who had a .3673 goals per game average for the Atlanta Silverbacks in the NASL between 2011 and 2012, and Chivas gave away Marvin Iraheta, a 21 year-old defensive midfielder who has played two years professionally already.